PPE Shortage Index designer Stephanie Zeller in front of her data painting representing Antarctic ice sheet thickness.
By Rebecca Finkel
As pandemic restrictions begin to lift, many of us are left facing questions that feel impossible to answer: Is it safe to visit family? Can my children go to school? Eat in or take out? What makes these decisions particularly difficult is that the risk we’re trying to avoid is largely invisible — How do you protect yourself from a danger that you can’t even see? Besides PPE, one of the best tools that we have in this fight is data.
Get Us PPE is the leading nonprofit distributing donated PPE in the United States, and we have collected the largest body of data related to the U.S. PPE shortage. Now we’re making this data available to the public. The newly launched Get Us PPE Shortage Index will provide monthly state- and national-level updates on the facilities requesting PPE, the types of items requested, the supply of PPE that facilities have remaining, and other information that can help get PPE to the frontline workers who need it most.
Research scientist and artist Stephanie Zeller is one of the creators of the Get Us PPE Shortage Index. She spoke to us about what we’ll learn from this data, how Get Us PPE and other organizations can use it, and how it might help us manage future crises long after the PPE shortage is over.
Why is data important during a PPE shortage?
It really gives us a good overview of what’s happening. We’re all scrambling to deal with this crisis right now, and the ability to collect this information nationwide really informs the way that we approach distributing PPE and the way that we handle this crisis, as well as the next one.
How does Get Us PPE collect this data?
If you are a group or facility that needs PPE, you can go to our website and fill out a PPE donation request form that includes a lot of information, including where you’re located, what type of group or facility you are, how you currently use PPE, and how much PPE you have left.
What have you learned from this data?
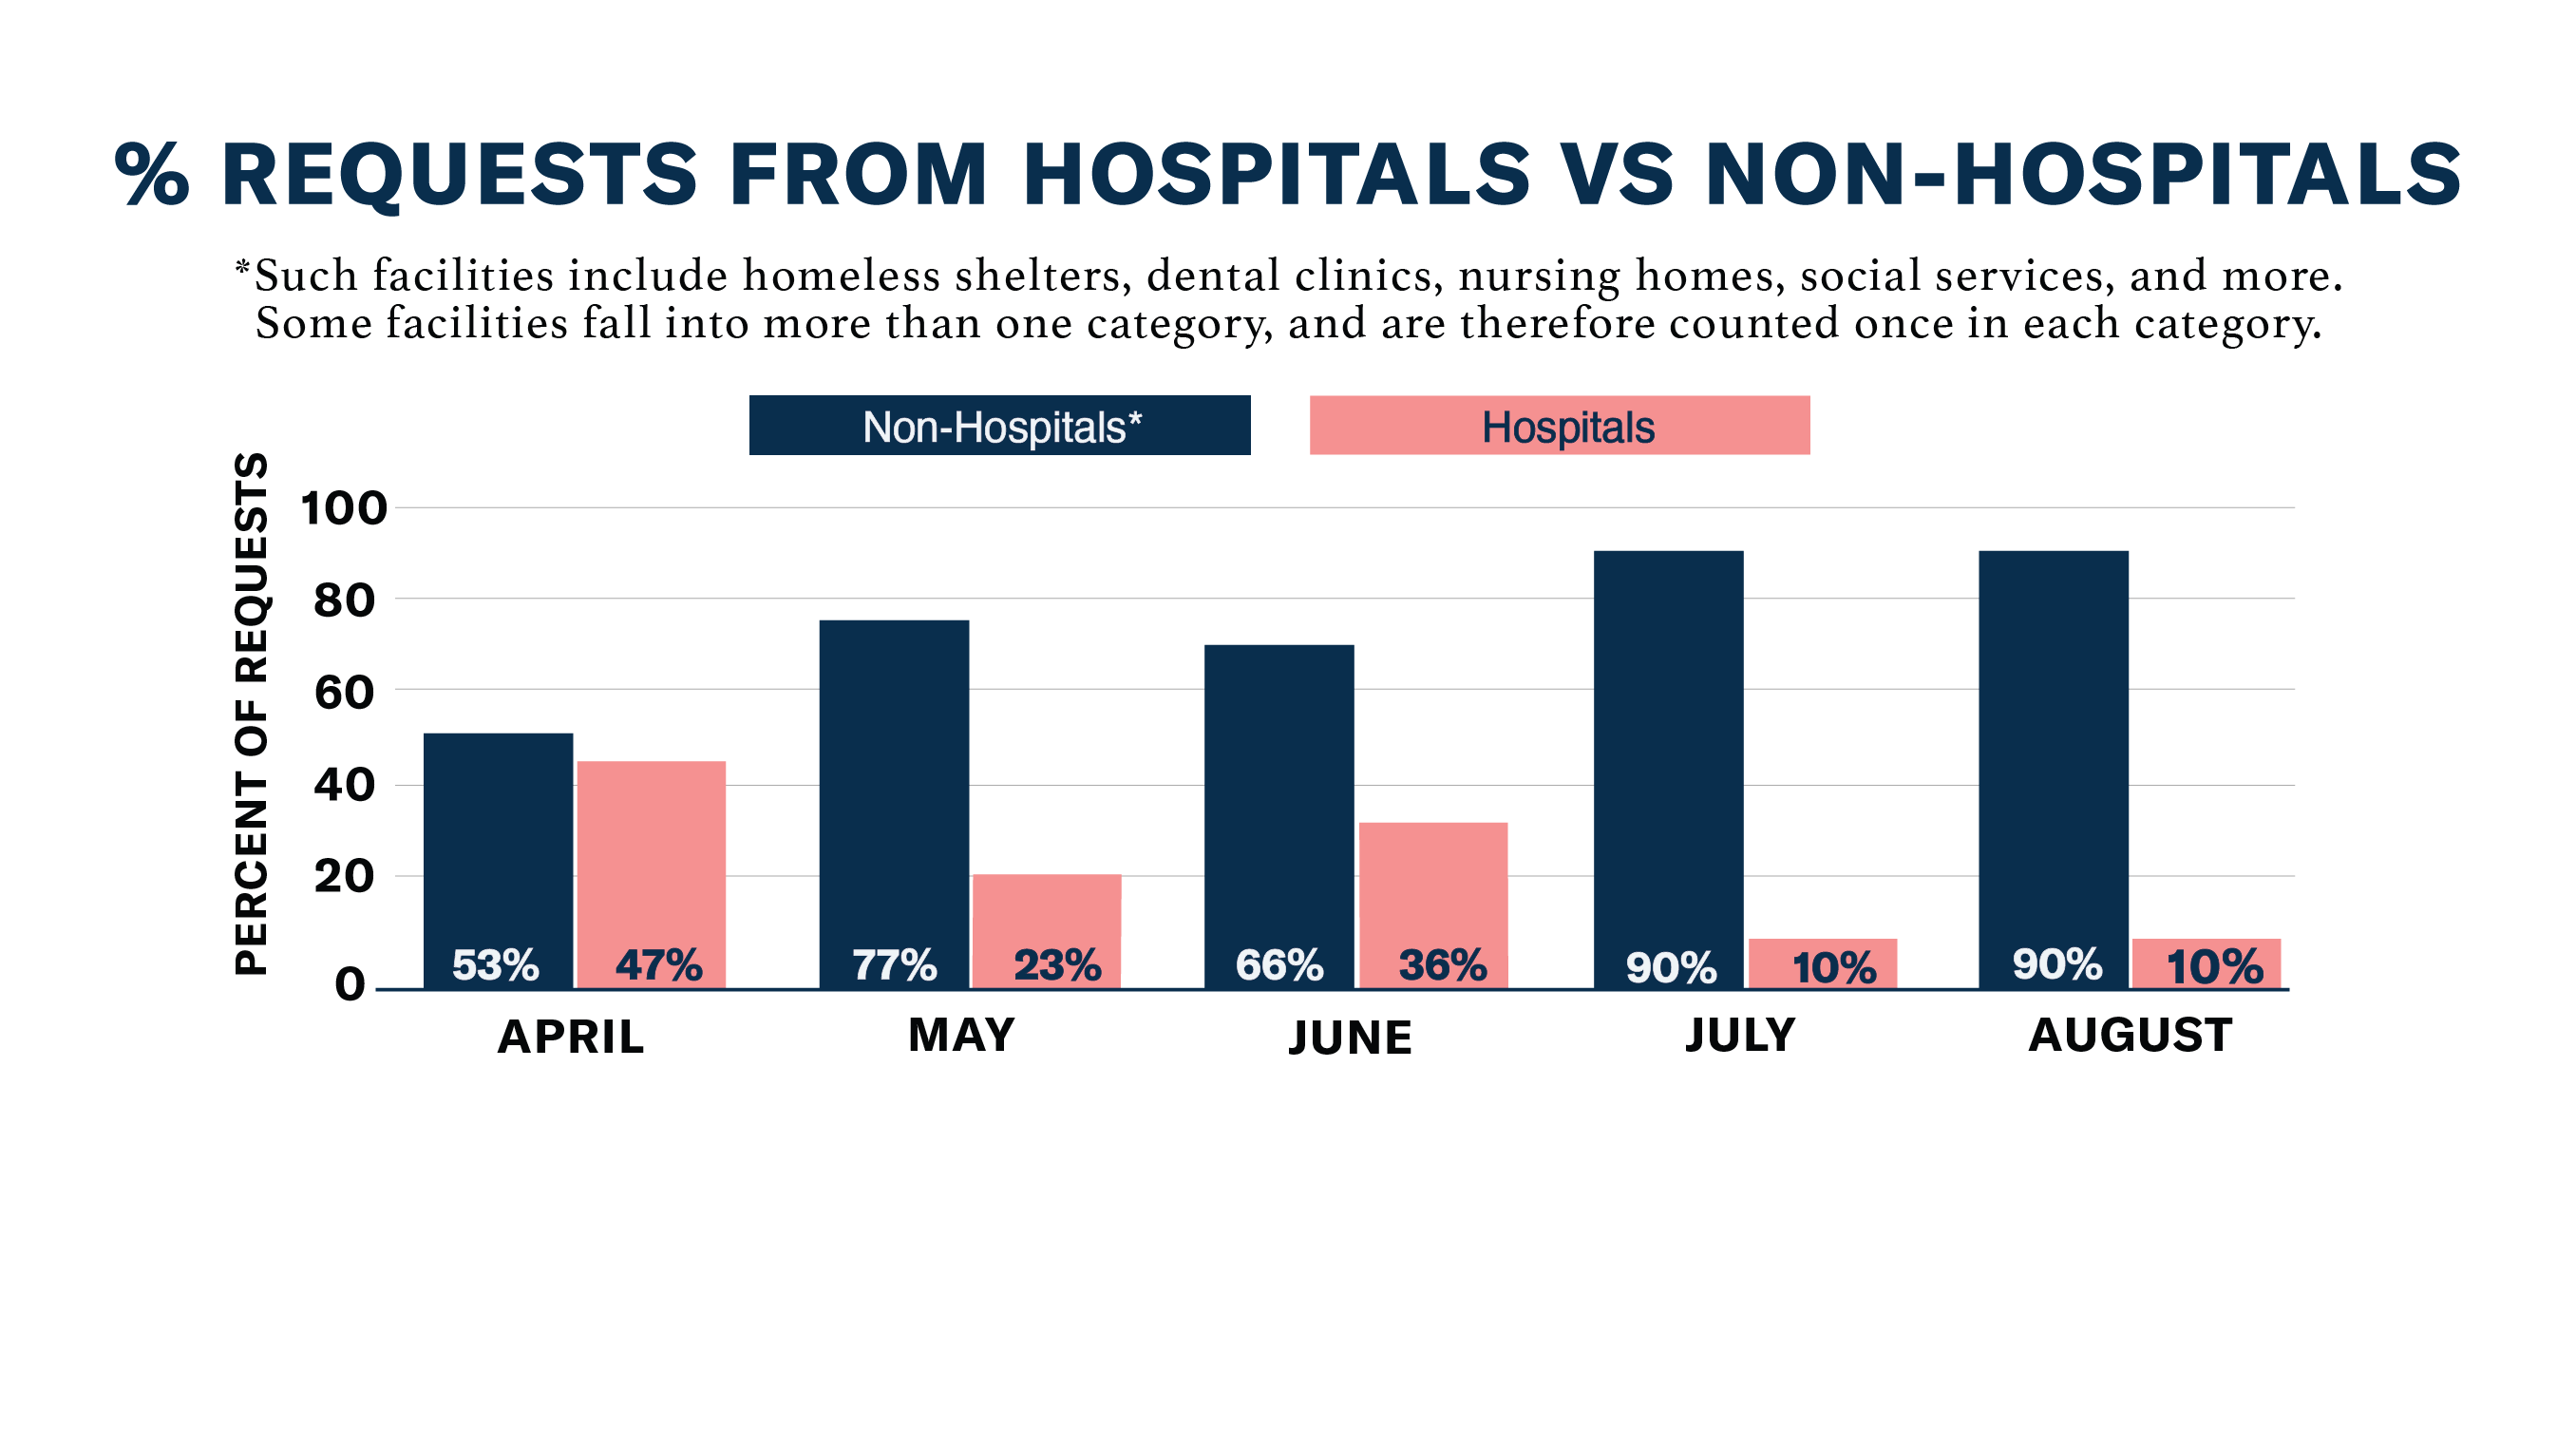
We’ve learned quite a bit, and we’ve noticed a few trends since we started in March. Because we are currently the largest group distributing PPE in the United States, we get a lot of requests from the healthcare industry. But as the supply chain started to recover, we noticed that larger hospitals and hospital systems in urban areas have been able to recover their PPE contacts and supplies, but smaller institutions and facilities are still really struggling. Requests from hospitals are going down, but requests from non-hospitals, such as prisons and nursing homes, are continuing to go up, percentage wise.
 How is Get Us PPE acting on this data?
The data is helping us approach distribution from an equity standpoint. We created something called the Fairness Framework, which we use to match suppliers and donations to requesters who need PPE in the most equitable way possible. One of the ways that we do that is by using the COVID-19 Community Vulnerability Index to determine who might be struggling the most, and who might need PPE the most. We also use the request form I mentioned earlier to see who has indicated that they have no supply of PPE remaining, and we take into account their geographic area.
What can the rest of us learn from this data?
As it stands, most of the data is state-level, so I think it would be really interesting to see the most requested PPE item for your state. For example, in Texas, most recently, the most requested item is disinfecting wipes. If you are a supplier that has this item, you could donate it to one of our local affiliates or help us distribute it. OR, if you’re not a frontline worker, you might decide to not buy that item until the shortage passes.
Can the maker community use this information as well?
Definitely. We have needs listed nationwide, as well as by state and by month. The maker community can use that information to respond to local needs and work with Get Us PPE to get those materials to health care workers.
Will this data be useful when the PPE shortage is over?
We’re thinking a lot about the upcoming coronavirus vaccine and how underserved communities are going to be impacted. These communities are likely going to have a harder time getting access to a vaccine, when we have one, especially due to disparities in access to care and insurance gaps due to job losses.
The Fairness Framework that we developed, along with the geographical data that we retained, could help us with vaccine distribution. These algorithms could also be useful during any kind of natural disaster in the future, to help get the right materials to the right places.
The coronavirus pandemic is really not like anything that’s happened in the recent past. The last time we had a pandemic like this was 1918, and we certainly didn’t have the technology that we have now to be able to deal with that. The way we handle this crisis will define how we handle a lot of things in the future, especially as climate change begins to reshape our environment on an exponential time scale. A lot is going to change in the next 30 years. I think what we’re doing here is a progenitor for more robust structures in the near future.
What do you say to people who are unsure of how to use data in their daily lives?
What got me interested in dealing with data in the first place was my interest in science and the natural world. I think of data as a way to understand big, overarching trends, as long as you temper it with on-the-ground knowledge, such as what this crisis looks like in your own community. It’s like painting: You can spend a lot of time working on the details, but you also need to step back to see the whole thing as one picture. That’s what data allows me to do.


